Insights
Insights are documents about a workflow execution.
The Insight Collector service produces them and attaches them to the workflow.
While the default configuration produces two insights, an execution log and a summary report, you can decide to produce only one of these insights or to produce additional insights, based on your preferences and needs.
This guide intends to help you understand how to configure the Insight Collector service, should you want to produce additional insights.
For example, you can produce a detailed execution log in case of failure, but a more succinct one in case of success. Similarly, your workflow may launch hundreds or thousands of tests and you can produce a global report for each test suite, and a detailed report for each failing test.
-
Execution Logs
A text file that contains the execution log of the workflow.
-
Surefire Global Reports
XML reports that contain information about the workflow execution.
-
Summary Reports
HTML reports that contain information about the workflow execution.
-
Testing your Definitions
You can dynamically test your insights definitions.
Common Configuration
Insights have a name, which will be used to name the file produced, and a kind, which will be used to determine the kind of insight produced.
The name does not have to be unique, but using different names for different insights is a recommended practice, as only the first produced insight with a given name will be attached to the workflow.
Names must start by a letter and can only contain lowercase letters, numbers, and hyphens
(^[a-z][a-z0-9-]*$).
Each insight also has an attached if conditional. If the conditional is not met, the insight
is not produced.
By default, the conditional is always(), which means that the insight is always produced.
You have access only to the workflow context in your
conditionals.
You can specify a spec part. This part is optional.
insights:
- name: my_insight  # required
  kind: MyInsight   # required
  if: success()     # optional ('always()' if not specified)
  spec:             # optional (default configuration for kind if not specified)
    ...
Tip
To apply your insights configuration, you need to pass the configuration file path
to the variable INSIGHTCOLLECTOR_CONFIGURATION when launching the orchestrator or the
Insight Collector service.
See “Reports Configuration File” for more information.
Execution Logs
Execution logs insights have the kind ExecutionLog. The
attachment’s filename is the name suffixed by .txt.
Examples: Execution logs definitions
The example below sets all execution log properties to 0 to ensure that the produced
execution log have the maximum possible depth:
insights:
- name: executionlog
  kind: ExecutionLog
  spec:
    step-depth: 0               # defaults to 1 if not specified
    job-depth: 0                # defaults to 1 if not specified
    max-command-length: 0       # defaults to 15 if not specified
    output-prefix: ''           # defaults to '[{timestamp}] [Job {job_id}]' if not specified
    show-notifications: 'true'  # defaults to false if not specified
    verbose: 'true'             # defaults to false if not specified; has no effect without show-notifications
The following example produces a more succinct execution log if the workflow is in success:
insights:
- name: executionlog
  kind: ExecutionLog
  if: success()
  spec:
    step-depth: 1
    job-depth: 1
    max-command-length: 15
- name: executionlog
  kind: ExecutionLog
  if: '!success()'
  spec:
    step-depth: 0          # defaults to 1 if not specified
    job-depth: 0           # defaults to 1 if not specified
    max-command-length: 0  # defaults to 15 if not specified
Note
This is a rare case where it is legitimate to have two insights with the same name. The first insight is produced if the workflow is successful, and the second insight is produced if the workflow is not successful.
Workflow Labels
If you want to specify the execution log detail level for a single workflow, you
must add some execution log specific labels under the metadata.labels section of
this workflow. The following labels are recognized:
| Label | Value | Required |
|---|---|---|
{executionlog name}/step-depth |
Step display depth | No |
{executionlog name}/job-depth |
Job display depth | No |
{executionlog name}/max-command-length |
Run commands display length in characters | No |
{executionlog name}/output-prefix |
Log line prefix | No |
{executionlog name}/show-notifications |
Show notification events | No |
{executionlog name}/verbose |
Show all notification events | No |
{executionlog name} prefix may be an ExecutionLog kind insight name from the service
configuration file. If no configuration file is provided, use executionlog as prefix
in order to overwrite default execution log parameters.
{executionlog name}/step-depth defines the step display depth for the execution
log of the workflow. If this value is set to 0, all steps are displayed, if it is
set to 1, only the steps of the first level are displayed and the nested steps
are hidden, if it is set to 2, the steps produced by providers are also displayed.
{executionlog name}/job-depth defines the job display depth for the execution log of
the workflow. If this value is set to 0, all jobs are displayed, if it is set to 1,
only the jobs of the first level are displayed and the nested jobs are hidden, if it
is set to 2, the jobs produced by generators are also displayed.
{executionlog name}/max-command-length sets the maximum display length of run commands,
measured in characters. 0 displays full commands, while any positive integer specifies
a maximum length.
{executionlog name}/output-prefix sets the log line prefix. Defaults to [{timestamp}] [Job {job_id}]
if not specified.
{executionlog name}/show-notifications controls whether notification events are shown in the execution log.
{executionlog name}/verbose controls whether all notification events are shown, including repeated ones.
Has no effect without {executionlog name}/show-notifications.
Info
The values set at the workflow level overwrite the values set in the service configuration
file. If a workflow contains no execution log related labels and the service configuration
file is not specified, the execution log parameters default to the following values:
step-depth=1, job-depth=1, max-command-length=15.
Note
Workflow labels can also be used to override the parameters of the execution log returned by
the observer’s GET /logs endpoint: in this case, you need to use live-executionlog as label prefix.
See the endpoint documentation for details.
Example: Usage of workflow labels
The following workflow contains all executionlog/... labels which are set to 0:
metadata:
  name: Robot test
  labels:
    executionlog/step-depth: '0'
    executionlog/job-depth: '0'
    executionlog/max-command-length: '0'
    executionlog/output-prefix: '<default>'
jobs:
 robot-execute-test:
    runs-on: [robotframework, linux]
    steps:
    - uses: robotframework/execute@v1
      with:
        test: robotframework/test_chars.robot
      working-directory: /home/user/directory
Warning
Workflow label values must be strings (and not integers): the numerical values must thus be quoted.
It will produce the following execution log, where all the steps are shown, and all commands are displayed at the full length:
[...]
<default> Running function robotframeworkexecutev1
<default>  Running function actionsdelete-filev1
<default>   Running command: rm -f log.html
<default>  Running command: robot $ROBOTFRAMEWORK_EXTRA_OPTIONS
--nostatusrc --listener "allure_robotframework;." "robotframework/test_chars.robot"
[...]
<default>  Running function actionscreate-archivev1
<default>   Running command: rm -f RobotFramework_reports.tar
<default>   Running command: rm -f tmp_tar_files
<default>   Running command: rm -f intentionally_empty_archive
<default>   Running command: rm -f list_tar_files
<default>   Running command: touch list_tar_files
[...]
Surefire Global Reports
Surefire global reports are machine-readable Surefire-like reports that contain information about the workflow execution. These reports are in JUnit XML format. The Insight Collector service produces them and attaches them to the workflow. For example, they can be attached to a GitLab merge request pipeline in order to display test execution results in the merge request.
The definition of a SurefireXmlReport insight is as follows:
- name: my_insight        # required
  kind: SurefireXmlReport # required
  if: success()           # optional ('always()' if not specified)
  spec:                   # optional (default configuration if not specified)
    scope:                # optional
As with all insights, if an if conditional is specified, the insight is only produced
if the conditional is met. (Note that you have access only to the workflow
context in your conditionals.)
The spec property allows for specifying scope part. You can use it
to filter the information displayed in the report.
The scope is an expression. Only test cases matching the specified expression are displayed
in the report. You can use the test context
in your scope expressions.
Example of a SurefireXmlReport
Let’s assume a workflow containing two jobs, junit-execute and mixed-execute,
and the following insights definition:
insights:
- name: xmlreport
  kind: SurefireXmlReport
  spec:
    scope: test.technology == 'junit'
Each job contains one test suite. junit-execute test suite contains one JUnit test,
mixed-execute test suite contains one JUnit and one Cypress test. When the workflow
is completed, the following Surefire global report will be produced, containing JUnit tests only:
<testsuites id="13226d9f-42ed-4259-8cbd-464a8c99a65a" name="Test results for the workflow 13226d9f-42ed-4259-8cbd-464a8c99a65a" tests="2" failures="1" errors="0" skipped="0" time="0.035">
  <testsuite id="ff94f196-7843-4b11-9ea9-b96ffa3b72c3" name="junit-execute.squash.tfauto.CalcNoDNTest" tests="1" failures="1" errors="0" skipped="0" time="0.016">
    <testcase id="f29aff7c-a6f8-4b2f-bb22-c55d7c75f8d4" name="subDNFailure" classname="junit-execute.squash.tfauto.CalcNoDNTest" timestamp="2024-04-30T10:30:39.653718" time="0.015">
      <failure message="" type="org.opentest4j.AssertionFailedError">
      org.opentest4j.AssertionFailedError: Le résultat du calcul est incorrect.
       10 - 5 n'est pas égal à 0 ==> expected: true but was: false at
       squash.tfauto.CalcNoDNTest.subDNFailure(CalcNoDNTest.java:13)</failure>
    </testcase>
  <testsuite id="9f86be1a-508d-45f5-9615-82ba6752f71a" name="mixed-execute.squash.tfauto.CalcTest" tests="1" failures="0" errors="0" skipped="0" time="0.020">
    <testcase id="8a3aaf81-dda3-4598-9d8e-ada004af74dd" name="subOK" classname="mixed-execute.squash.tfauto.CalcTest" timestamp="2024-04-30T10:30:39.653718" time="0.020">
    </testcase>
  </testsuite>
</testsuites>
In the generated report, <testsuite> elements id property takes as value the id
of a job that executed the test suite.
Summary Reports
Summary reports are HTML reports that contain information about the workflow execution. The Insight Collector service produces them and attaches them to the workflow.
The definition of a SummaryReport insight is as follows:
- name: my_insight     # required
  kind: SummaryReport  # required
  if: success()        # optional ('always()' if not specified)
  title: "My Insight Report"
                       # optional
  spec:                # optional (default configuration if not specified)
    ...
As with all insights, if an if conditional is specified, the insight is only produced
if the conditional is met.
The insight’s title, if specified, is used as the report’s title. It defaults to Test
Execution Summary Report.
The summary report is generated from the execution log and the workflow metadata.
It may contain any combination of the following sections, in any order and in any number (but there must be at least one section):
| Section kind | Description |
|---|---|
SummaryBlock |
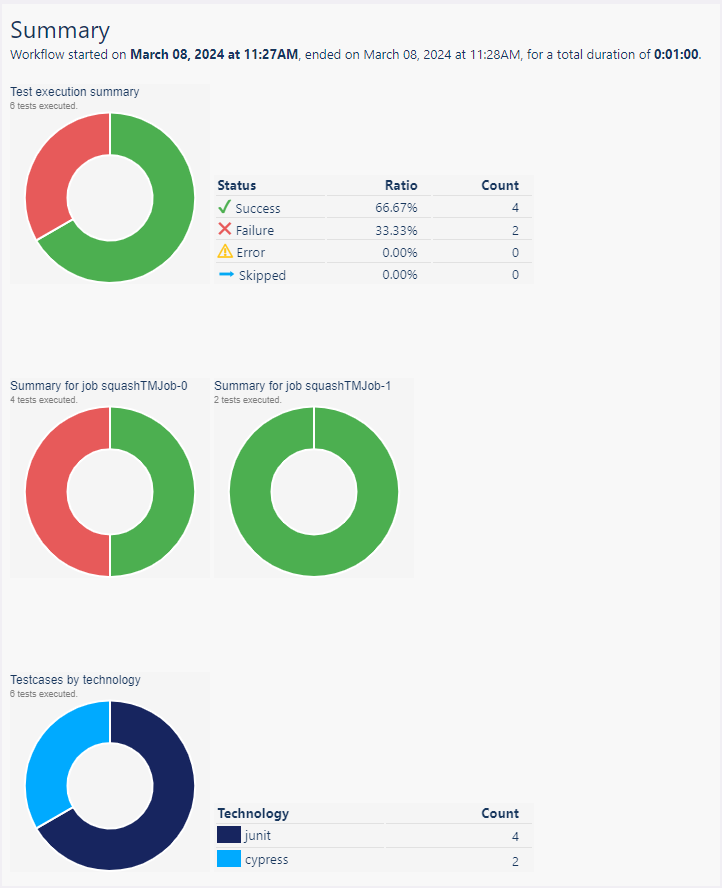
A section with two or three parts. The first part is the test execution summary. The second part if the jobs summaries (if there is only one job in the workflow, it is not shown, as it would be just like the first part). The third part is the technologies summary. |
Cloud |
A cloud of items. Items displayed can be configured, and a filter (scope) can be specified. |
Table |
A table of items. Items displayed can be configured, columns can be defined, and a filter (scope) can be specified.Some columns can open a popup window displaying more information. |
BarChart |
A bar chart, displaying a series of numerical values. Items displayed can be configured, the axis order specified, and titles can be set. |
ProgressBar |
A progress bar. In many ways an ‘horizontal’ doughnut. Items displayed can be configured, the data to aggregate and the aggregation function can be defined. |
ScatterChart |
A scatter chart. Items displayed can be configured. It allows to display the relationship between two values. |
The spec part is optional. If not specified, the default sections configuration is used.
It is as follows:
insights:
- name: htmlreport
  kind: SummaryReport
  title: "Test Execution Summary Report"
  spec:
    template:
    - name: Summary
      kind: SummaryBlock
    - name: Jobs
      kind: Cloud
      datasource: jobs
    - name: Tags
      kind: Table
      datasource: tags
    - name: Test Cases
      kind: Table
      datasource: testcases
    - name: Execution Times by Technology
      kind: ProgressBar
      datasource: testcases
      groupBy: test.technology
      data: execution.duration
      aggregateFunction: sum
    - name: Test Cases Execution Time
      kind: BarChart
      datasource: testcases
      secondaryAxis:
        data: execution.duration
      primaryAxis:
        ticks: hidden
        title: Test Cases
        data: test.testCaseName
It summarizes all jobs and test cases and displays all tags.
The spec section, if specified, can contain the following elements:
spec:
  scope:                   # optional
  scripts:                 # optional
  style:                   # optional
  template:                # required
  - name: A Section        # required
    kind: SummaryBlock     # required
    scope:                 # optional
    skipIfNotFound:        # optional (false if unspecified)
  - name: Another Section  # required
    kind: Cloud            # required
    datasource: jobs       # required
    scope:                 # optional
    skipIfNotFound:        # optional (false if unspecified)
  - name: Another one      # required
    kind: Table            # required
    datasource: testcases  # required
    scope:                 # optional
    skipIfNotFound:        # optional (false if unspecified)
    columns:               # optional (default columns based on data source if
                           #           not specified)
      name: expression     # required (if `columns` is specified, there must be
                           #           at least one column defined)
      ...
  - ...
(The template list must contain at least one section. It can be of any kind. The sections can be in any order, and it’s just fine to have multiple sections of any given kind.)
Scopes
By default, the reports summarize all jobs and test cases and display all tags. This
may be too much information for a large workflow. You can use the scope part to filter
the information displayed in a summary report.
The scope is an expression. Only test cases matching the specified expression are displayed
in the summary report. You can use the test context
in your scope expressions.
You can specify a scope at spec level. You can also specify it in the template elements.
Those specifications are cumulative. If a scope is specified at spec level and at template
level, the scopes are combined.
For example, if spec.scope is test.technology == 'junit', and if the Testcases template
has a scope test.outcome == 'failure', the test cases table will display only the failed JUnit
test cases.
Scripts
By default, the summary reports make use of two open-source JavaScript libraries:
<script src="https://cdnjs.cloudflare.com/ajax/libs/list.js/1.5.0/list.min.js"></script>
<script src="https://cdn.jsdelivr.net/npm/chart.js"></script>
You can use the scripts element to redefine those, for example if you are restricted to
an intranet.
The scripts element, if defined, replaces the above scripts.
Style
By default, the summary reports use a built-in CSS definition. You can enhance this styling by
applying an external CSS stylesheet or specifying the style element. This allows you to
change the colors, add a company logo, … User-defined styles complement
the default CSS, they do not replace it.
Customizing Styles
You can customize the colors representing test case statuses in the test cases table and summary block. To do so, simply add the following variables to your style definition and update their values as desired:
:root {
    --success: #4CAF50;
    --failure: #E75A5A;
    --error: #FFC107;
    --skipped: #03A9F4;
}
External Stylesheets and Styles Prioritization
To apply an external CSS stylesheet to the generated summary reports, place the .css file
in the css subdirectory located within the directory specified by the Insight Collector service’s
configurations_path path parameter. Default path is /app/insights/css.
The css subdirectory can contain more than one CSS file. You can assign numerical prefixes to set
their priority. For example, if the configurations_path/css directory contains the files 01_style.css
and 02_style.css, the styles defined in the second file will take precedence over the first.
The styles specified in the style property of the summary report will take precedence over those defined
in the external CSS style sheets.
Data sources
There are three data sources:
| data source | description |
|---|---|
jobs |
The set of all jobs |
tags |
The set of all tags |
testcases |
The set of all test cases |
If a scope is specified, the sets will be constrained by the scope.
For more information, see “Data sources models.”
skipIfNotFound
The template’s items all share a common skipIfNotFound element.
If it is set to true (a boolean), then the section is silently skipped if the data source
is empty.
For example, you may want to have a detailed section for failed test cases, but do not want to see it if there were no failed test case.
If you do not set this element, it defaults to false, and the section will be present
in the report, with a line saying that there were no matching items.
Sections
SummaryBlocks
SummaryBlocks are sections of the summary report. They are defined by their name and
kind properties. The name property is used to name the section in the report.
The sections have two or three parts. The first part is the test execution summary. The second part is the jobs summaries (if there is only one job in the workflow, it is not shown, as it would be just like the first part). The third part is the technologies summary.
Clouds
Clouds blocks are sections of the summary report. They are defined by their name and
kind properties. The name property is used to name the section in the report.
They have a mandatory datasource element, and they may have a scope element too.
The datasource element defines the items shown in the cloud block. It must be jobs.
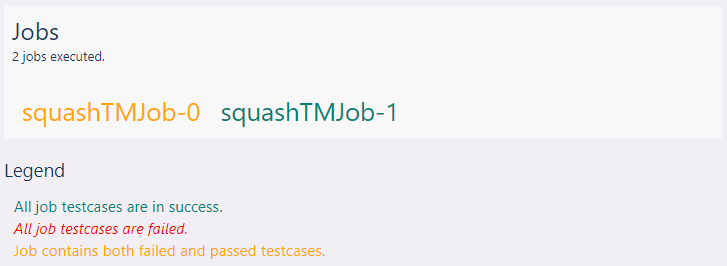
Note
The only cloud block available is the Jobs cloud, so you can only use jobs as a
data source.
Tables
Tables blocks are sections of the summary report. They are defined by their name and
kind properties. The name property is used to name the section in the report.
They have a mandatory datasource element, and they may have a scope element too.
The datasource element defines the rows shown in the table. You can use the tags data source
to display the tags in a table, and the testcases data source to display the test cases in a
table.
Info
For information on data paths available for a given data source, see “Data sources models.”
There are default columns specifications, per data sources. You can provide your own columns
specifications by using the columns element, which is a collection of name, expression pairs.
The name is the column header, and the expression is the cell content.
Example of a tags table
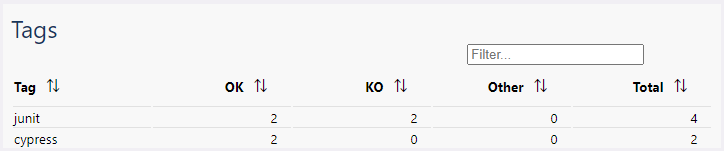
The default columns are defined as such:
columns:
  Tag: metadata.name
  OK: status.testCaseStatusSummary.success
  KO: status.testCaseStatusSummary.failure
  Total: status.testCaseCount
For the columns values, which are JSON paths, you can use elements included in the
tags data source model.
The numeric values are displayed right-aligned, the other are shown as-is.
Example of a testcase table
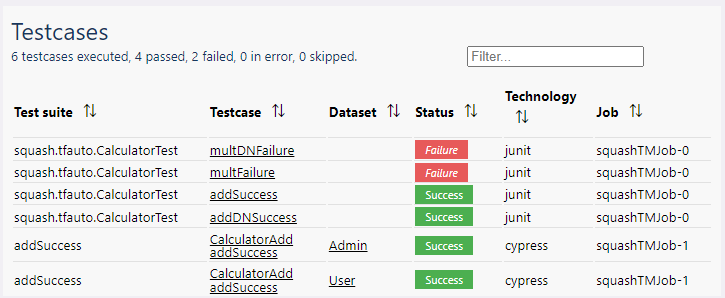
The default columns are defined as such:
columns:
  Test suite: test.suiteName
  Testcase: test.testCaseName
  Dataset: test.data
  Status: test.outcome
  Test technology: test.technology
  Job: test.job
For the columns values, which are JSON paths, you can use elements included in the
testcases data source model.
There are special renderings for the test.testCaseName, test.outcome, test.data, and test.suiteName values.
The other values are displayed as is.
BarCharts
Bar charts are sections of the summary report. They are defined by their name and kind
properties. The name property is used to name the section in the report.
They have a mandatory datasource element, and they may have a scope element too.
The datasource element defines the data shown in the bar chart. You can use the testcases
data source to display the test cases in a bar chart. You can also use the jobs or tags
datasources.
Info
For information on data paths available for a given data source, see “Data sources models.”
The primaryAxis element defines the primary axis of the bar chart. It has a mandatory data
element, which is a JSON path to the data to display. It may have a title element, which is
the title of the axis. It may have a ticks element, which can be hidden to hide the ticks.
It may have a reversed element, which can be true to reverse the order of the items.
The secondaryAxis element defines the secondary axis of the bar chart. It has a mandatory data
element, which is a JSON path to the data to display. It may have a title element, which is
the title of the axis. It may have a ticks element, which can be hidden to hide the ticks.
It may have a min element, which is the minimum value of the axis. It may have a max element,
which is the maximum value of the axis.
The data element of the secondaryAxis must refer to a numerical value.
The following table list all possible elements. The mandatory ones are highlighted:
name: Bar Chart                   # mandatory
kind: BarChart                    # mandatory
if: {condition}                   # optional
datasource: jobs|tags|testcases   # mandatory
scope: {scope}                    # optional
orderBy:                          # allows to choose non-default order, optional
  key: {sorting key}              # mandatory
  order: ascending|descending     # optional, defaults to ascending
maxItems: {int}                   # optional
primaryAxis:                      # mandatory
  data: {data.path}               # mandatory
  title: {axis title}             # optional
  ticks: hidden                   # optional
  reversed: {bool}                # optional, defaults to false
secondaryAxis:                    # mandatory
  data: {data.path}               # mandatory
  title: {axis title}             # optional
  ticks: hidden                   # optional
  min: {int}                      # optional
  max: {int}                      # optional
legend: {legend text}             # optional
orientation: horizontal|vertical  # optional, defaults to horizontal
Example: The default bar chart
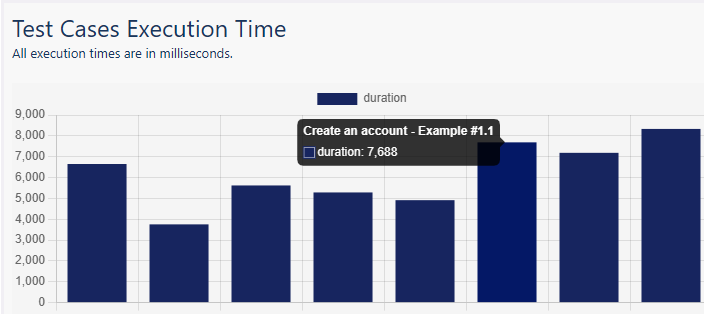
The following bar chart, part of the default summary report, displays the execution time of the test cases, per technology. It is defined as follows:
name: Test Cases Execution Time
kind: BarChart
datasource: testcases
primaryAxis:
  ticks: hidden
  title: Test Cases
  data: test.testCaseName
secondaryAxis:
  data: execution.duration
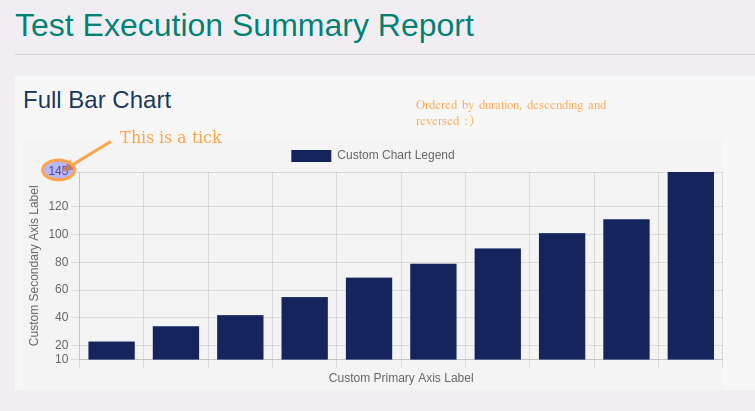
Example of a summary report with just one barchart section
The following HTML report configuration:
insights:
- name: full-barchart-all-options
  kind: SummaryReport
  spec:
    template:
    - name: Full Bar Chart
      kind: BarChart
      if: workflow.status == 'success'
      datasource: testcases
      scope: 'true'
      orderBy:
        key: execution.duration
        order: descending
      maxItems: 10
      primaryAxis:
        data: test.testCaseName
        title: Custom Primary Axis Label
        ticks: hidden
        reversed: true
      secondaryAxis:
        min: 10
        max: 145
        title: Custom Secondary Axis Label
        data: execution.duration
      legend: Custom Chart Legend
      orientation: horizontal
generates the following bar chart (the combined use of orderBy, descending, maxItems, and
reversed allows to have a chart representing the top-most execution times, in ascending order):
ProgressBars
Progress bars are sections of the summary report. They are defined by their name and kind
properties. The name property is used to name the section in the report.
They have a mandatory datasource element, and they may have a scope element too.
The datasource element defines the data shown in the progress bar. You can use the testcases
data source to display the test cases in a progress bar. You can also use the jobs or tags
datasources.
Info
For information on data paths available for a given data source, see “Data sources models.”
The groupBy element defines the grouping of the data. It is a JSON path to the data to group by
(for example, test.technology).
The aggregateFunction element defines the aggregation function to apply to the data. It can be
count, sum, avg, min, or max.
The data element defines the data to display. It is a JSON path to the data to display.
It must refer to a numerical value. It is required when aggregateFunction is not count.
The following table list all possible elements. The mandatory ones are highlighted:
name: Progress Bar                        # mandatory
kind: ProgressBar                         # mandatory
if: {condition}                           # optional
datasource: jobs|tags|testcases           # mandatory
scope: {scope}                            # optional
groupBy: {data.path}                      # mandatory
data: {data.path}                         # mandatory if aggregateFunction != count
aggregateFunction: count|sum|avg|min|max  # mandatory
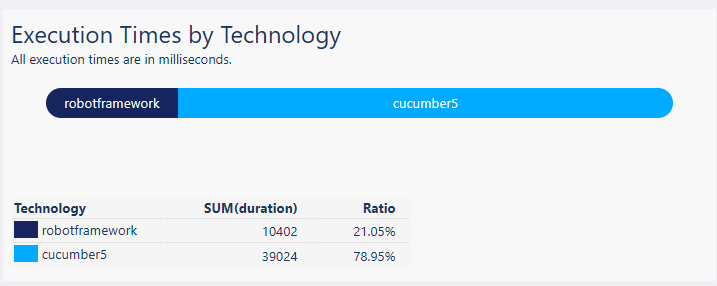
Example: the default progress bar
The following progress bar, part of the default summary report, displays the execution time of the test cases, per technology. It is defined as follows:
name: Execution Times by Technology
kind: ProgressBar
datasource: testcases
groupBy: test.technology
data: execution.duration
aggregateFunction: sum
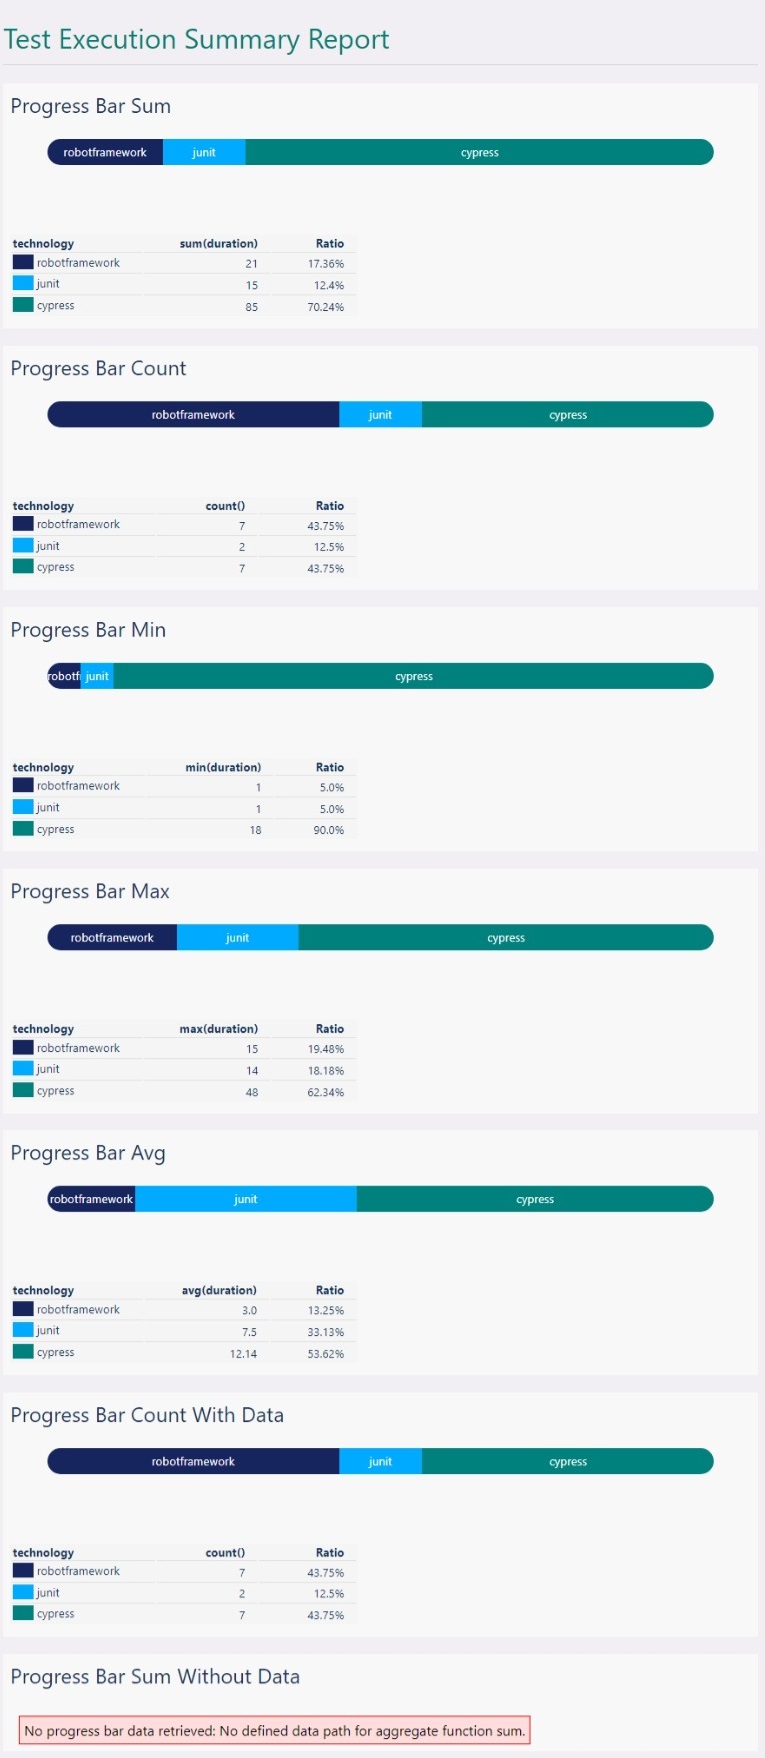
Examples: progress bar examples
The following HTML report configuration:
insights:
- name: html-report
  kind: SummaryReport
  spec:
    template:
    - name: Progress Bar Sum
      kind: ProgressBar
      aggregateFunction: sum
      datasource: testcases
      groupBy: test.technology
      data: execution.duration
    - name: Progress Bar Count
      kind: ProgressBar
      aggregateFunction: count
      datasource: testcases
      groupBy: test.technology
    - name: Progress Bar Min
      kind: ProgressBar
      aggregateFunction: min
      datasource: testcases
      data: execution.duration
      groupBy: test.technology
    - name: Progress Bar Max
      kind: ProgressBar
      aggregateFunction: max
      datasource: testcases
      data: execution.duration
      groupBy: test.technology
    - name: Progress Bar Avg
      kind: ProgressBar
      aggregateFunction: avg
      datasource: testcases
      data: execution.duration
      groupBy: test.technology
    - name: Progress Bar Count With Data
      kind: ProgressBar
      aggregateFunction: count
      datasource: testcases
      data: execution.duration
      groupBy: test.technology
    - name: Progress Bar Sum Without Data
      kind: ProgressBar
      aggregateFunction: sum
      datasource: testcases
      groupBy: test.technology
generates the following progress bars (the last example, “Progress Bar Sum Without Data”, illustrate what occurs if the specification is invalid, here it is missing a data part):
ScatterCharts
Scatter charts are sections of the summary report. They are defined by their name and kind
properties. The name property is used to name the section in the report.
They have a mandatory datasource element, and they may have a scope element too.
The datasource element defines the data shown in the scatter chart. You can use the testcases
data source to display information coming from the test cases. You can also use the jobs or
tags datasources.
Info
For information on data paths available for a given data source, see “Data sources models.”
The groupBy element, which is a JSON path to the data to group by, is mandatory.
The primaryAxis element defines the primary axis of the scatter chart. It has a mandatory data
element, which is a JSON path to the data to display. It may have a title element, which is
the title of the axis. It may have a min element, which is the minimum value of the axis.
It may have a max element, which is the maximum value of the axis.
The following table list all possible elements. The mandatory ones are highlighted:
name: {item_name}                # mandatory
kind: ScatterChart               # mandatory
if: {condition}                  # optional
datasource: jobs|tags|testcases  # mandatory
scope: {scope}                   # optional
groupBy: {data.path}             # mandatory
primaryAxis:                     # mandatory
  data: {data.path}              # mandatory
  title: {custom axis title}     # optional
  min: {int}                     # optional
  max: {int}                     # optional
  ticks: hidden                  # optional
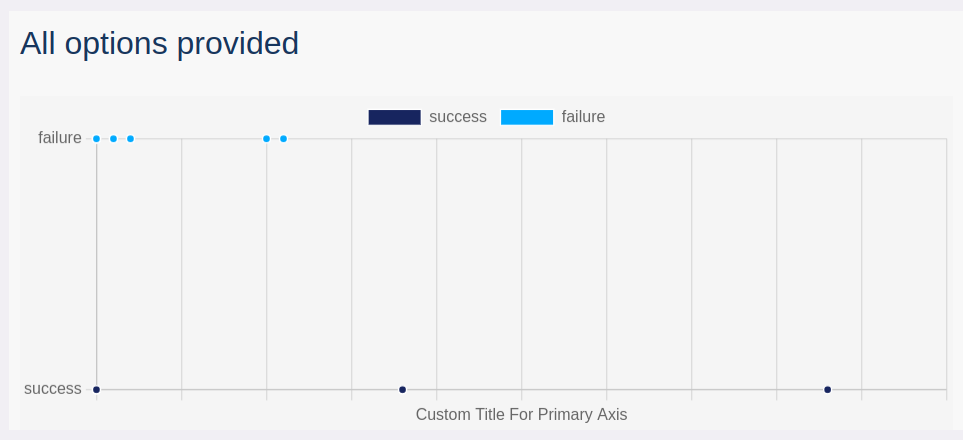
Example: test cases duration, per test outcome
The following HTML report presents the test cases duration, per test outcome:
insights:
- name: scattercharts
  kind: SummaryReport
  title: Another Summary Report Displaying Scatter Charts
  spec:
    template:
    - name: All options provided
      kind: ScatterChart
      datasource: testcases
      groupBy: test.outcome
      primaryAxis:
        data: execution.duration
        min: 0
        max: 50
        title: Custom Title For Primary Axis
        ticks: hidden
Examples
The first example produces a summary report that contains only the summary block and the jobs cloud, for successful workflows:
insights:
- name: htmlreport
  kind: SummaryReport
  if: success()
  title: "Test Execution Summary Report"
  spec:
    template:
    - name: Summary
      kind: SummaryBlock
    - name: Jobs
      kind: Cloud
      datasource: jobs
The following example produces a summary report that contains the summary block, the tags table, and a test cases table per test kinds (here, assuming the front-end tests were written in Robot Framework, the back-end tests in JUnit, and other tests in some other technologies), for all workflows:
insights:
- name: htmlreport
  kind: SummaryReport
  title: "Test Execution Summary Report"
  spec:
    template:
    - name: Summary
      kind: SummaryBlock
    - name: Tags
      kind: Table
      datasource: tags
    - name: Front-End Test Cases
      kind: Table
      datasource: testcases
      scope: test.technology == 'robotframework'
      skipIfNotFound: true
    - name: Back-End Test Cases
      kind: Table
      datasource: testcases
      scope: test.technology == 'junit'
      skipIfNotFound: true
    - name: Other Test Cases
      kind: Table
      datasource: testcases
      scope: test.technology != 'robotframework' && test.technology != 'junit'
      skipIfNotFound: true
The columns in the test cases tables are the default ones.
The third example produces a summary report that contains the summary block, and a test cases table for all non-successful test cases. The columns are adjusted, so that they only contain the name of the testcase and the status of the testcase:
insights:
- name: htmlreport
  kind: SummaryReport
  title: "Failed Tests Execution Summary Report"
  spec:
    template:
    - name: Summary
      kind: SummaryBlock
    - name: Failed Test Cases
      kind: Table
      datasource: testcases
      scope: test.outcome != 'success'
      skipIfNotFound: true
      columns:
        Test name: name
        Test status: test.outcome
The last example produces a summary report that only contains a test cases table for all
non-successful test cases with default columns. The style of the summary report is adjusted
using style element in order to add a logo on the top of the page, and the
scripts element is used to override default libraries location. Please note that in the
scripts element, opening and closing <script> tags are provided, whereas style
element content is not surrounded by tags.
insights:
- name: htmlreport
  kind: SummaryReport
  title: "Failed Tests"
  spec:
    style: |
      body::before {
         content: '';
         background: url('path/to/logo.jpg');
         background-size: 100px 100px;
         display: inline-block;
         width: 100px;
         height: 100px;
      }
    scripts: |
      <script src="https://127.0.0.1/local_scripts/list.min.js"></script>
      <script src="https://127.0.0.1/local_scripts/chart.js"></script>
    template:
      - name: Failed Test Cases
        kind: Table
        datasource: testcases
        scope: test.outcome == 'failure'
Testing your Definitions
You can use the opentf-ctl tool to test your insights definitions on
a completed workflow.
For example, to test the definitions in the insights.yaml file, you can use the
following command:
> opentf-ctl get workflows
WORKFLOW_ID                           STATUS  NAME
48744ed2-c7a3-4323-9b40-4e6d9b1faf8a  DONE    My Workflow
> opentf-ctl generate report 487 using insights.yaml
Next Steps
Here are some helpful resources for taking your next steps with insights
- “Expressions” for an in-depth view of all possible things you can use in expressions
- “Contexts” for an in-depth view of all possible contexts you can use in expressions
- “Reports Configuration File” for more information on how to deploy your configuration.
- “Dynamic Reports Generation” for more information on how to test your reports definitions.